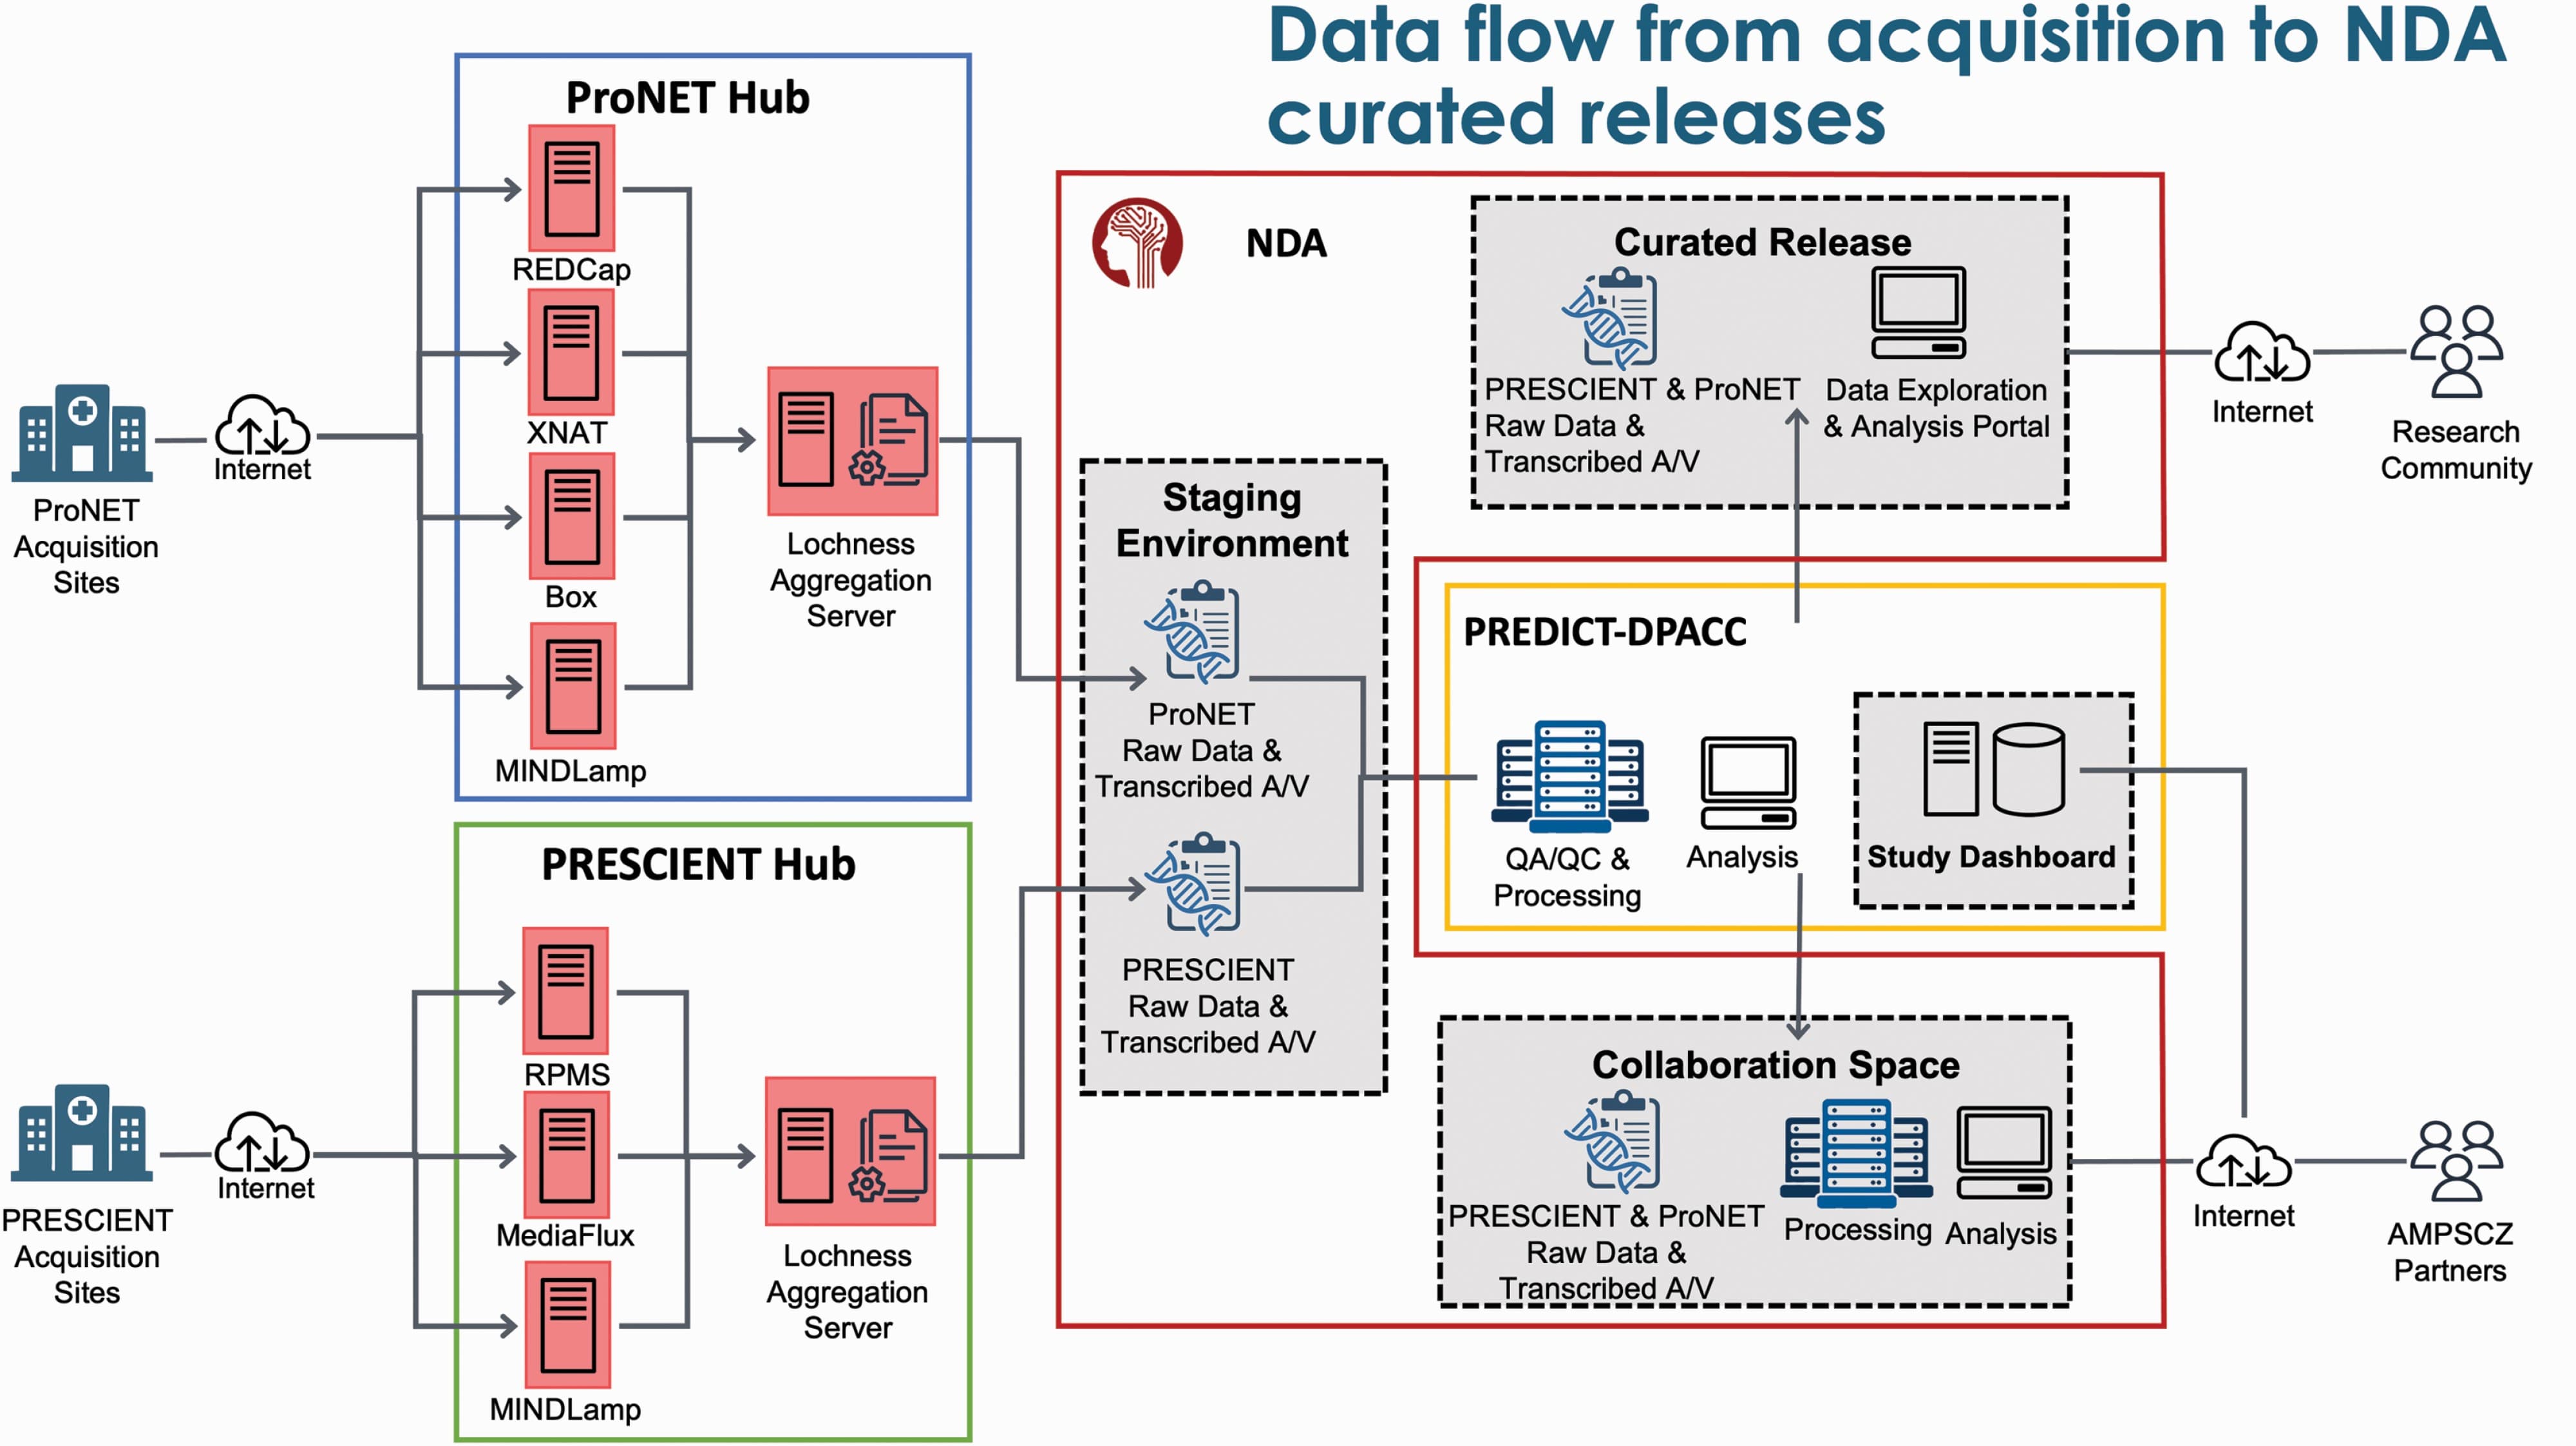
I have been working on the AMP-SCZ project at the Psychiatry and Neuroimaging Lab (PNL) at Harvard Medical School for a few months now. In this post, I will provide a brief overview of the data flow in the AMP-SCZ project.
Overview
From the AMP-SCZ website:
The Accelerating Medicines Partnership (AMP®) SCZ program aims to generate tools that will fast-track the development of effective, early-stage treatments for people who are at risk for schizophrenia.
The AMP-SCZ project is multi-site research study with sites spanning 12+ countries, and 2 research networks. The networks are:
- ProNET: Which includes sites in the US, Canada, and Europe and others.
- PRESCIENT: Which includes sites in Australia, Asia and others.
Each site is part of a reseach network that collects different modalities of data including Clinical interviews, EEG, MRI, Actigraphy, clinical assessments, Speech and Vieo samples. The data is collected from participants who considered ‘at-risk’ (CHR) for schizophrenia, and Healthy Controls (HC). The data is collected at multiple time points (24 months), and the goal is to identify biomarkers that can predict the onset of schizophrenia.
For a deeper reading, please refer to the Accelerating Medicines Partnership® Schizophrenia (AMP® SCZ): Rationale and Study Design of the Largest Global Prospective Cohort Study of Clinical High Risk for Psychosis.
Data Flow

Due to the multi-site nature of the project, the data flow in the AMP-SCZ project is not straightforward. The data flow can be broadly divided into the following steps:
-
Data Collection: Data is collected at each site using different modalities. The collecteded data is stored in different ‘sources’ as approriate. e.g.:
- Clinical data (surveys) is collected using REDCap (ProNET) and RPMS (PRESCIENT)
- EEG and MRI data is collected using XNAT (ProNET) and Mediaflux (PRESCIENT)
- Actigraphy data is collected using Mindlamp
- Speech data is collected using Box (ProNET) and Mediaflux (PRESCIENT)
-
Data Aggregation: This happens in multiple stages:
-
Data is first aggregated at the network level. e.g. all the data from ProNET sites is aggregated into a single ‘source’ for ProNET.
- This is achieved using lochness, which builds out a data lake for each network. The data lake contains all the data collected accross all sites for a given network.
- The aggregated data is then synced with a NDA S3 bucket (visualised as staging on the image above)
-
Data is then aggregated at the project level. e.g. all the data from ProNET and PRESCIENT is aggregated into a single ‘source’ for AMP-SCZ.
- All the data from the staging area is pulled into a single ‘source’ for AMP-SCZ.
- The data is harmonized so that the data from different networks can be compared.
-
-
Data Processing: The data is then processed to generate variables of interest. This includes:
- QC of the data
- Computing different variables of interest
- Generating reports
-
Data Visualization and Analysis: The processed data is then visualized and analyzed to generate insights. This includes:
- Visualizing data availability across different sites and modalities
- Data is visualized primarily using DPDash site source and shared to various stakeholders.
Different working groups as outlined in the AMP-SCZ Study Design paper are then able to utilize the data for their specific analyses.
-
Data Sharing: The data is then shared with the broader scientific community, as a NDA curated release, to facilitate further research.
Conclusion
This post provides a brief overview of the data flow in the AMP-SCZ project. Further posts will explore more aspects of the project in detail.